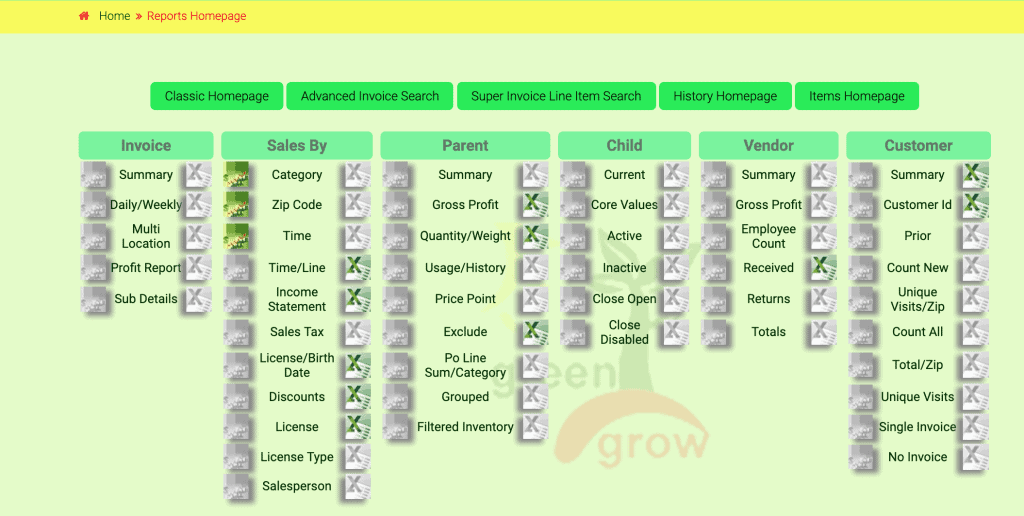
We wanted to give you a quick reference guide to our new and improved Reports Homepage. Here we have broken each section down into individual reports, with a short explanation and instructional for each. In order to access the Reports Homepage, the user requires permission id=146. Additionally, there are a few reports on this page that require further admin permissions.
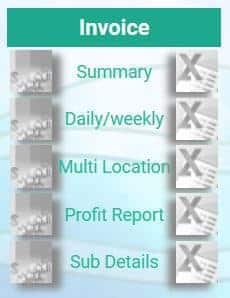
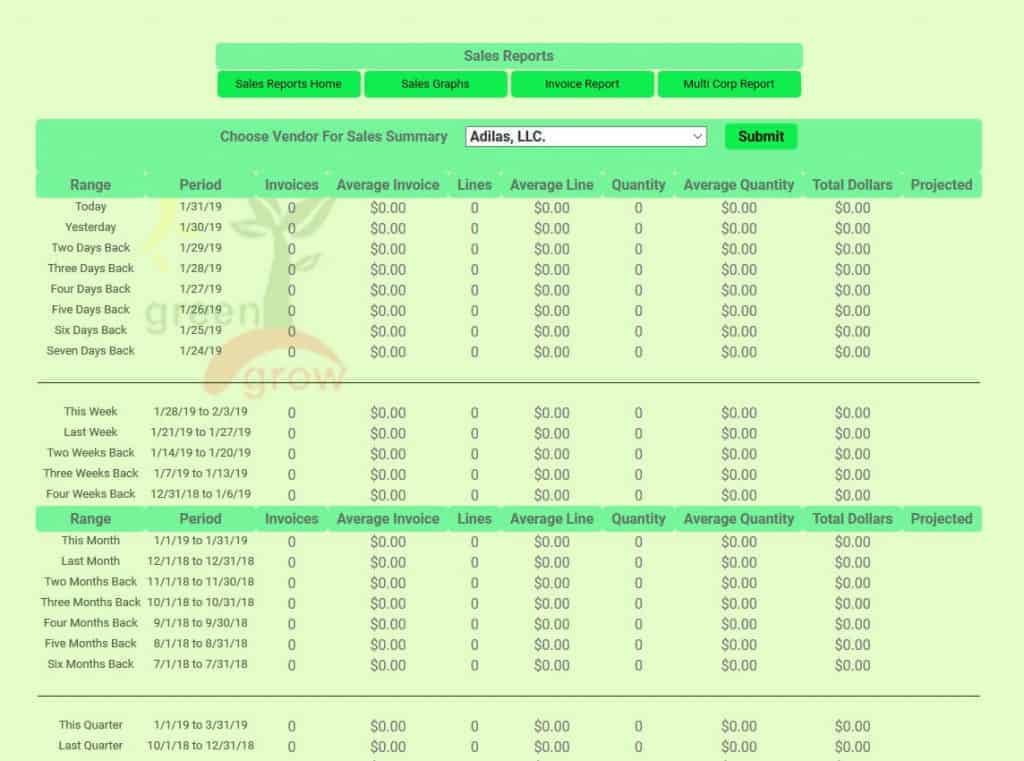
INVOICE SUMMARY
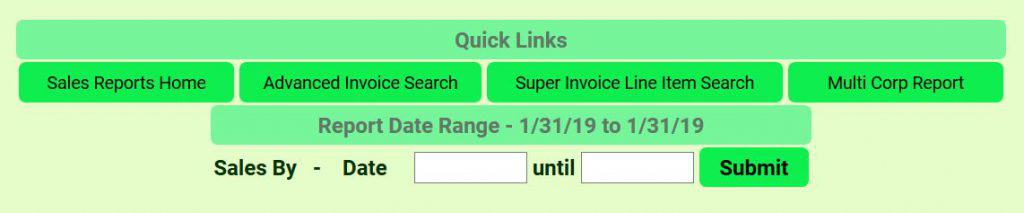
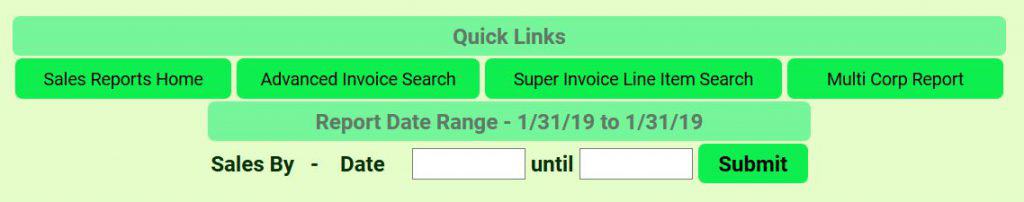
This report gives you the ability to see a quick breakdown of all of the Sales in a summary of days, weeks, months, and years; side by side.
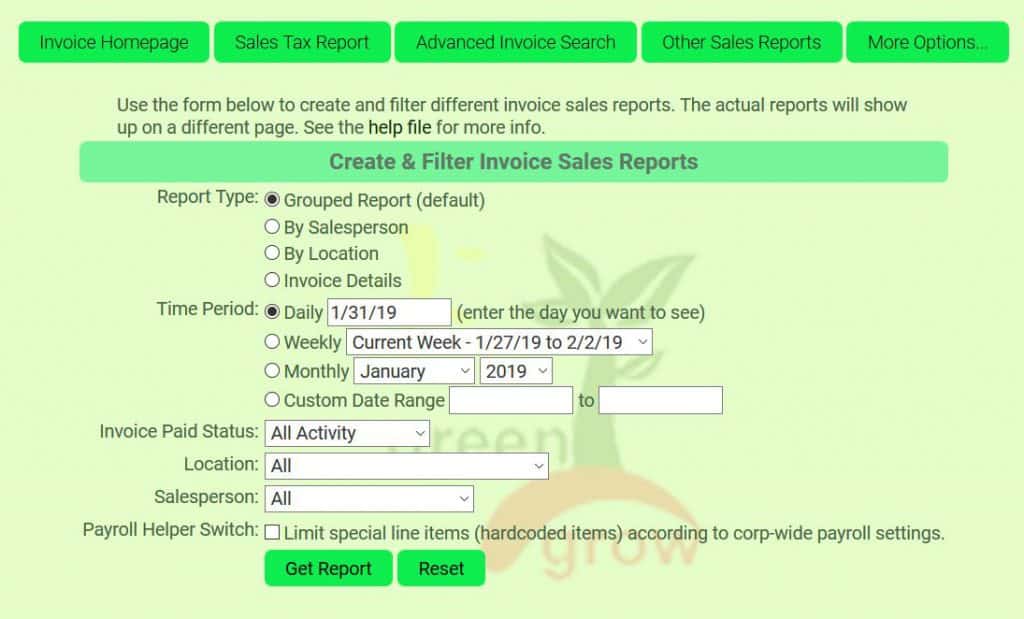
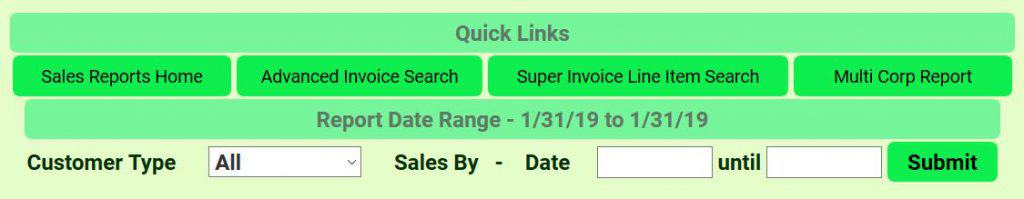
DAILY/WEEKLY
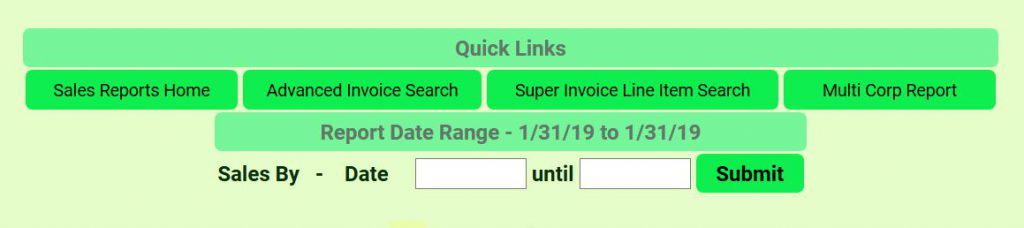
This report gives you the ability to pull a sales report for a specific time period. Daily, Weekly, Monthly reporting choices available. (Single Location)
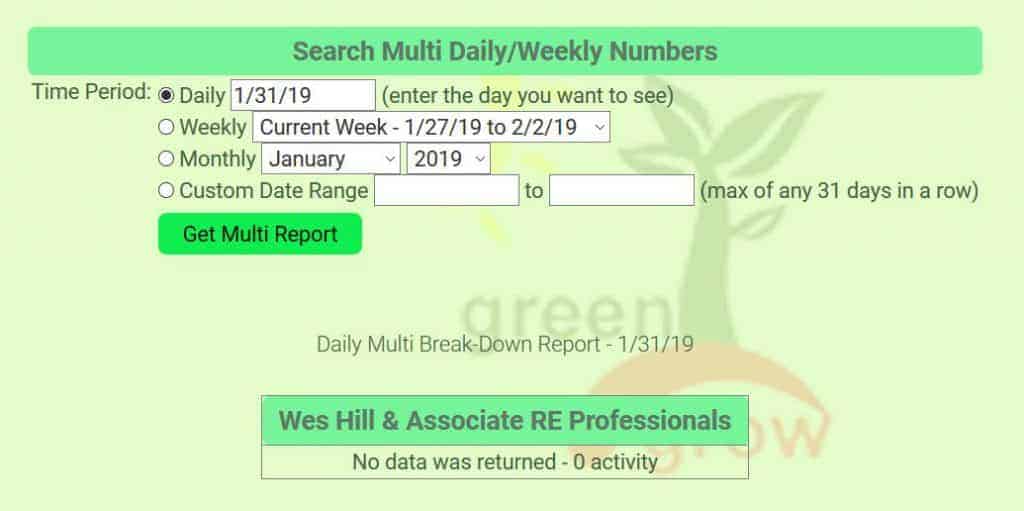
MULTI-LOCATION
This report gives you the ability to pull a sales report for a specific time period. Daily, Weekly, Monthly reporting choices available. (Multiple Locations/Corps)
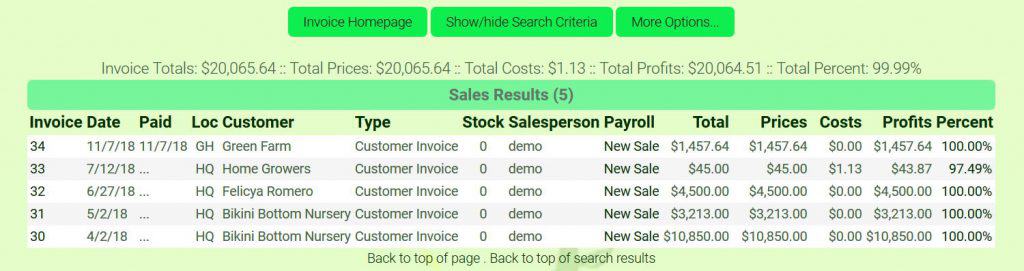
PROFIT REPORT
This report breaks down your days sales into cost/profit margins and totals.
SUB DETAILS
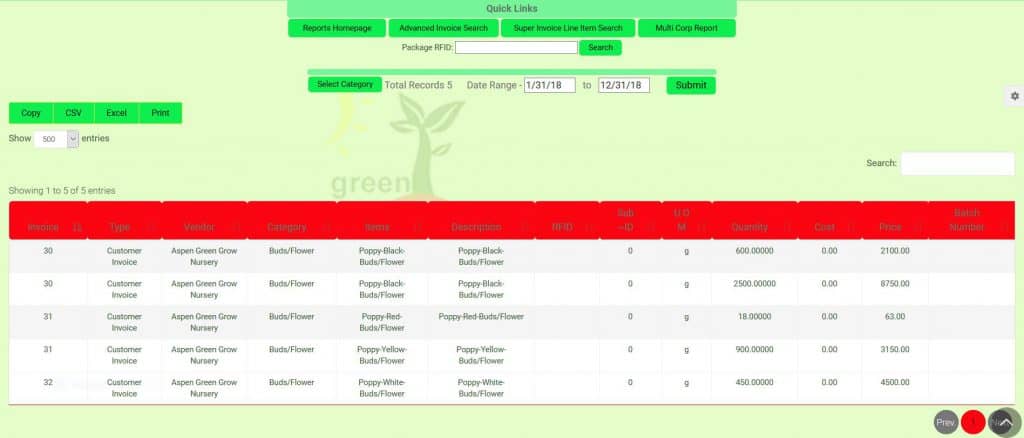
This report allows you to pull an invoice report per date and category. Can be copied or pulled into .csv or Excel files.
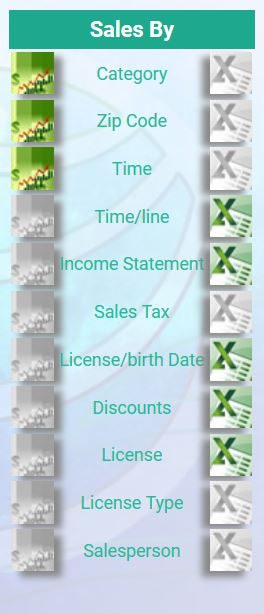
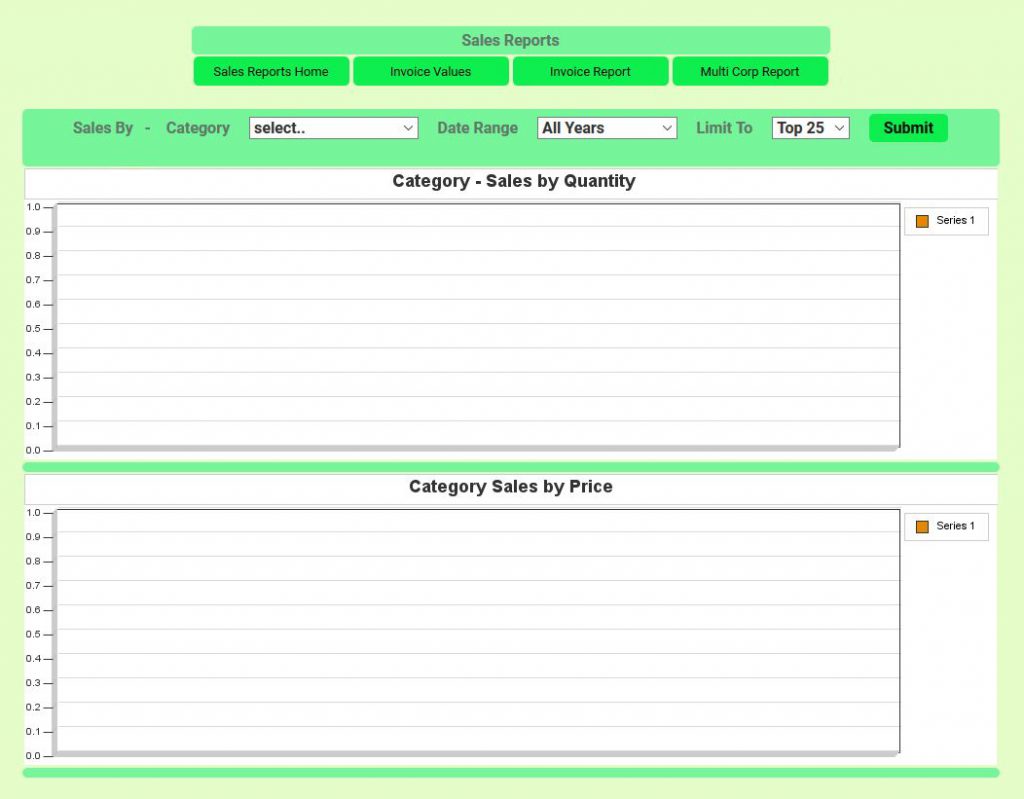
CATEGORY
This report allows you to see your Category Sales by Quantity and Price, searched by multiple date range choices. You may also choose to see the top 50 items, and all the way down to the top five items (in increments of 5).
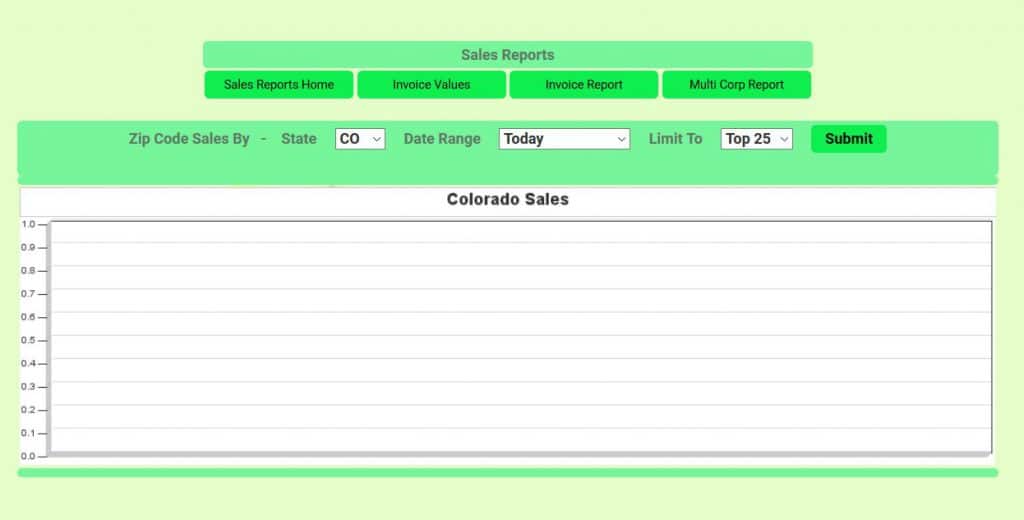
ZIP CODE
Using this report, you can search customer sales by Zip Code and Date Range. You may also choose to see the top 50 items, and all the way down to the top five items (in increments of 5).
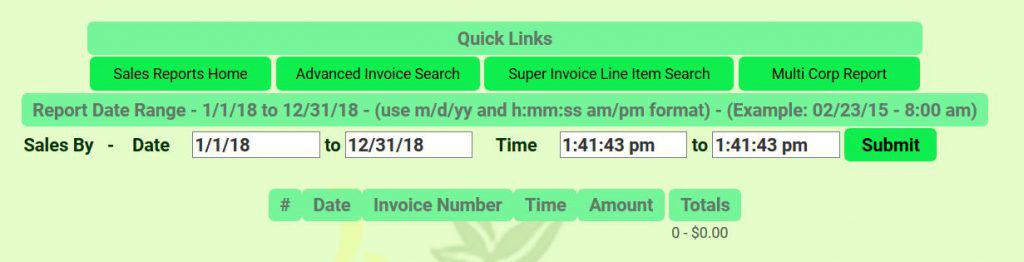
TIME
This report allows you to search sales by Date and Time. It shows a list of sales in that date range and what time they were started. This report is particularly useful when needing more time data to match up sales with those in Metrc.
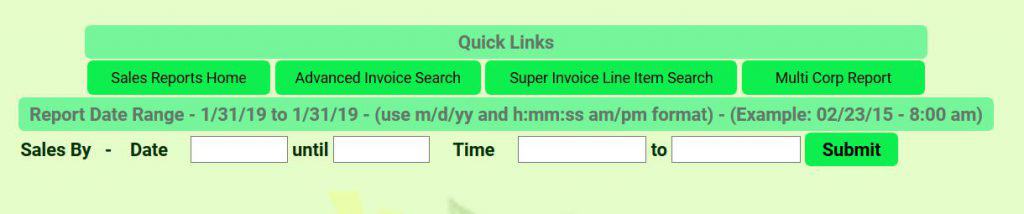
TIME LINE
This report allows you to search sales by Date and Time, and has the added information of showing what items were sold, as well as quantity sold, price, and time it was sold. Also helpful when matching up times sold in Metrc.
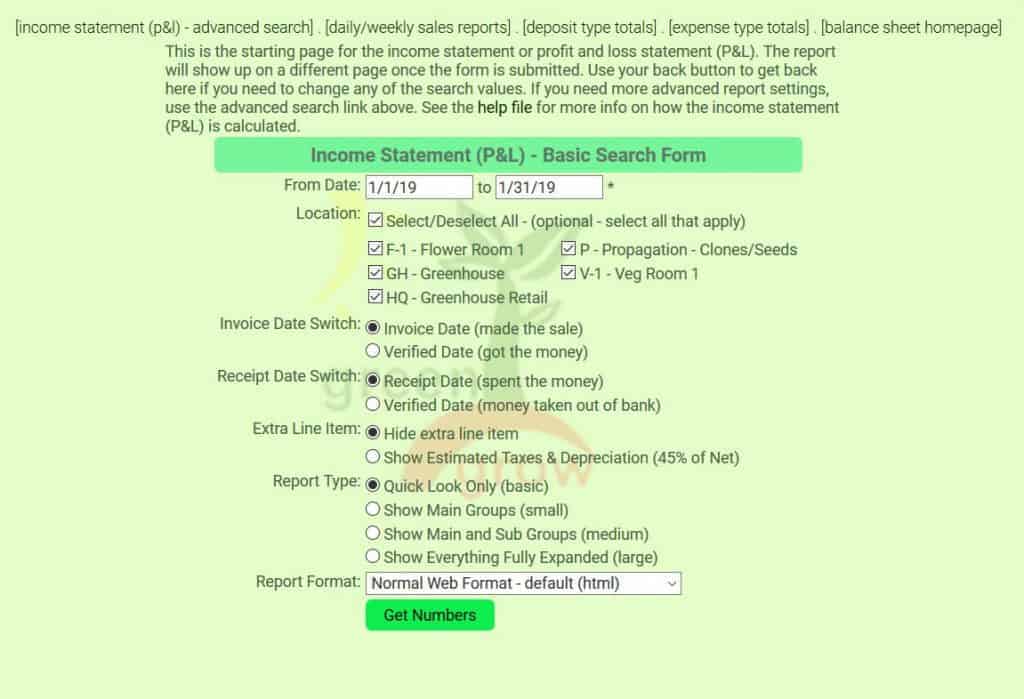
INCOME STATEMENT
The income statement is your window into the financial status of your business. Everything from revenue, cost of goods, and profit can be seen all at once. *Admin level permission required for access to the income statement.
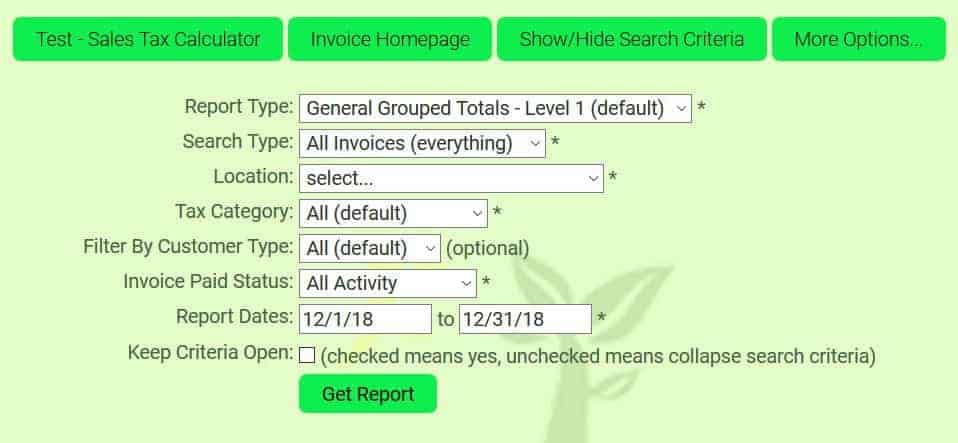
SALES TAX
The sales tax report will show a break down of the amount of sales tax that has been collected for the month. Depending on the settings you entered on the location homepage, you will see a variety of different taxes, eg. state, county, city.
LICENSE/BIRTH DATE
If your company tracks customer license numbers or birth dates, you can pull information on this customer activity using the license/birth date report. It will show category information, items quantity, unit of measurement, and sale price.
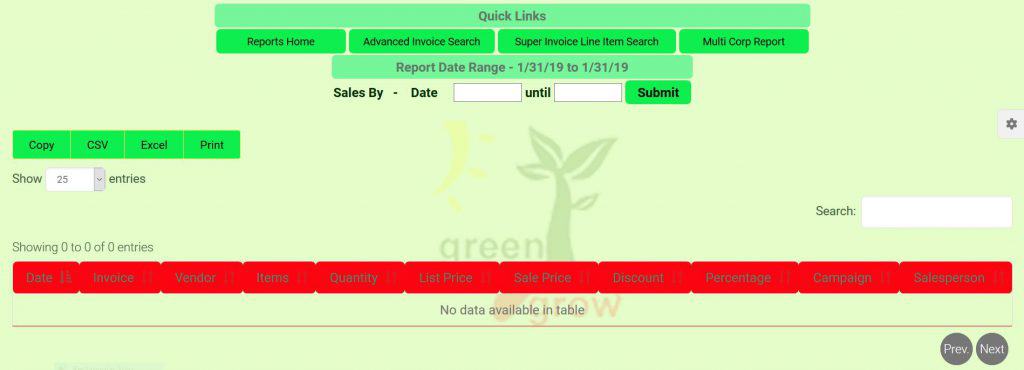
DISCOUNTS
You can use this report to see all discounts on line items for a specific date range. Data will also include invoice number, vendor, item, quantity, original price of item, sale price of item, discounted dollar amount, discount percentage given, name of discount campaign, and budtender/salesperson.
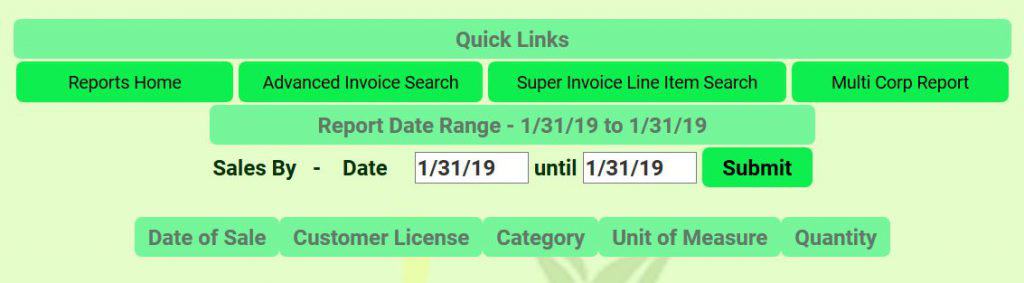
LICENSE
If you track license information on a customer (eg. MMR License # for Medical Dispensary), then this report will show you customer data by license number including category and quantity purchased during a specified time frame.
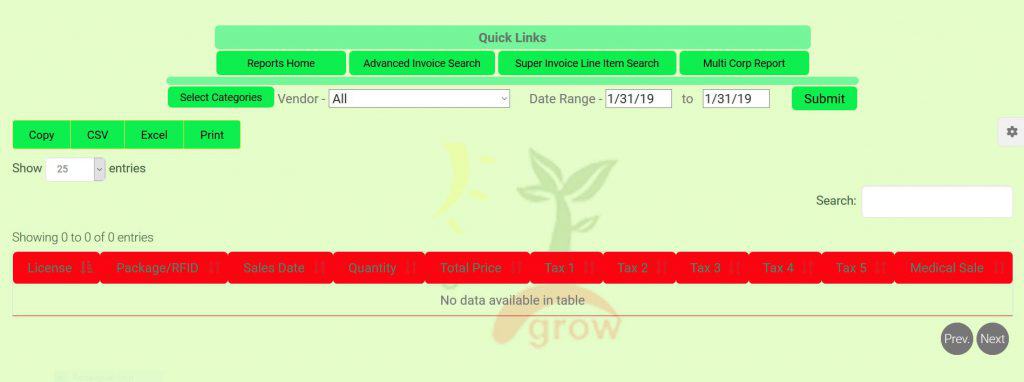
LICENSE TYPE
Again, if you track license information on a customer (eg. MMR License # for Medical Dispensary), then this report will show you customer data by license number including quantity, price, and sales taxes for a particular date range.
SALESPERSON
This is a great report for seeing at a glance exactly what each salesperson sold during a specified time period. In addition to the salesperson and their id, it shows vendor, items, quantity and price.
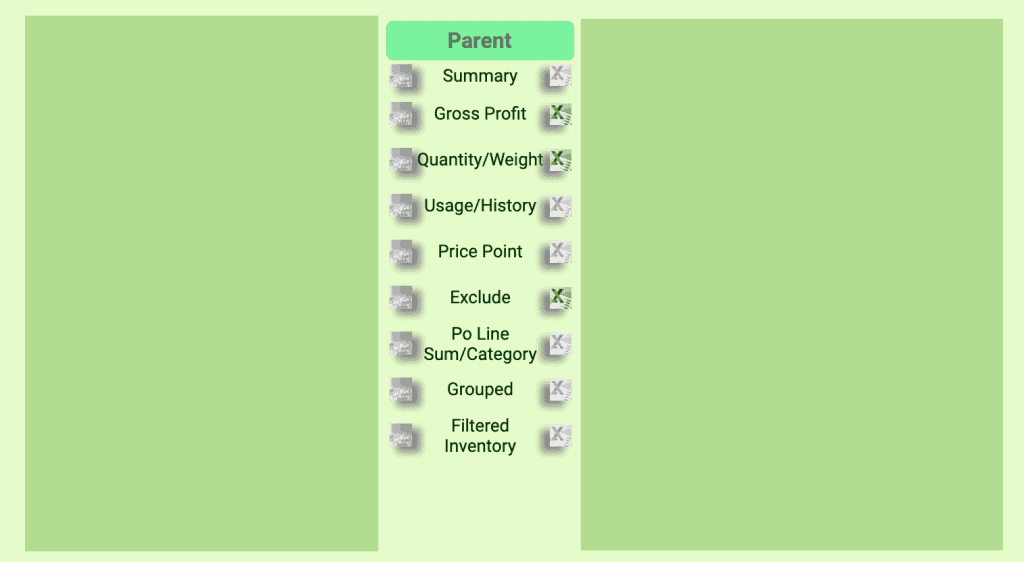
SUMMARY
Overview of Parent items- report shows category, vendor, item, unit of measurement, quantity in inventory, cost and price. **If you have a system that has been very active for awhile this report may not pull due to too much data.
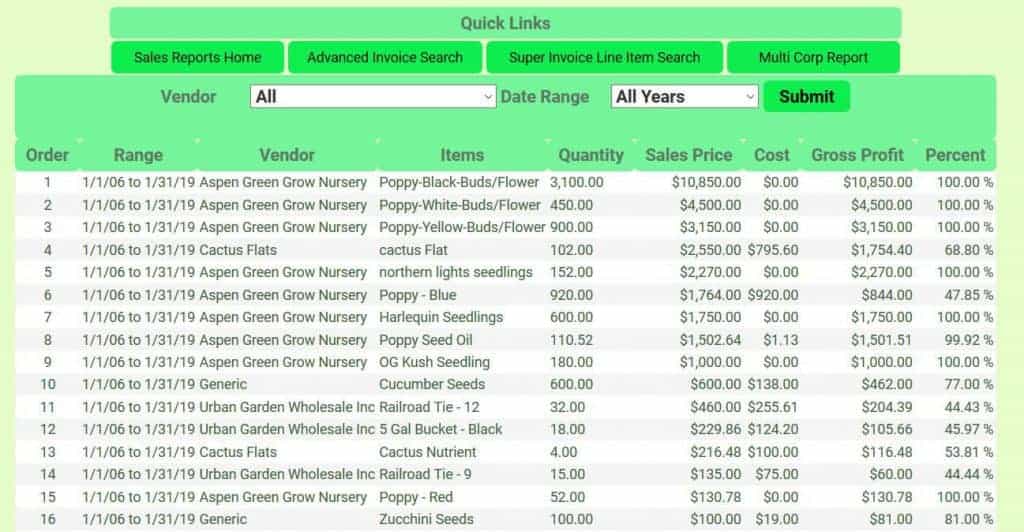
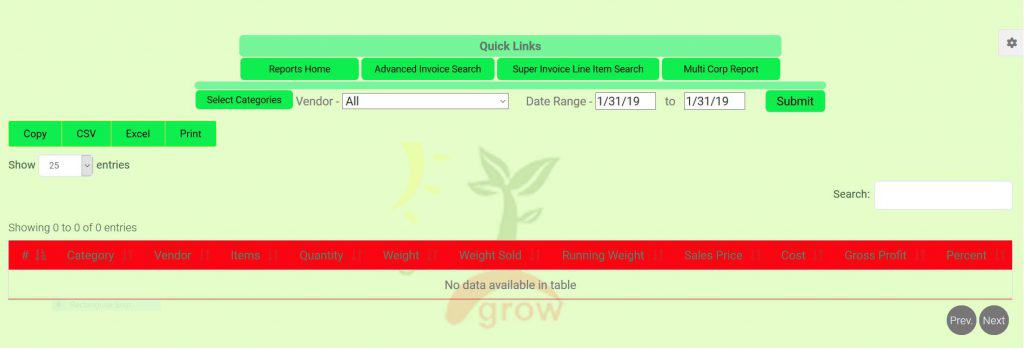
GROSS PROFIT
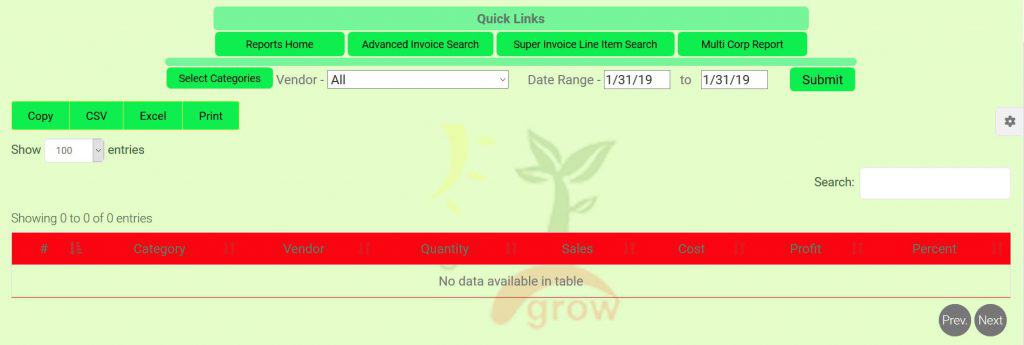
Once you choose a date range and vendor (or you may choose ‘all’), you can see what your gross profit was by item. It also displays the percentage of profit, as well as the quantity sold, sale price, and cost.
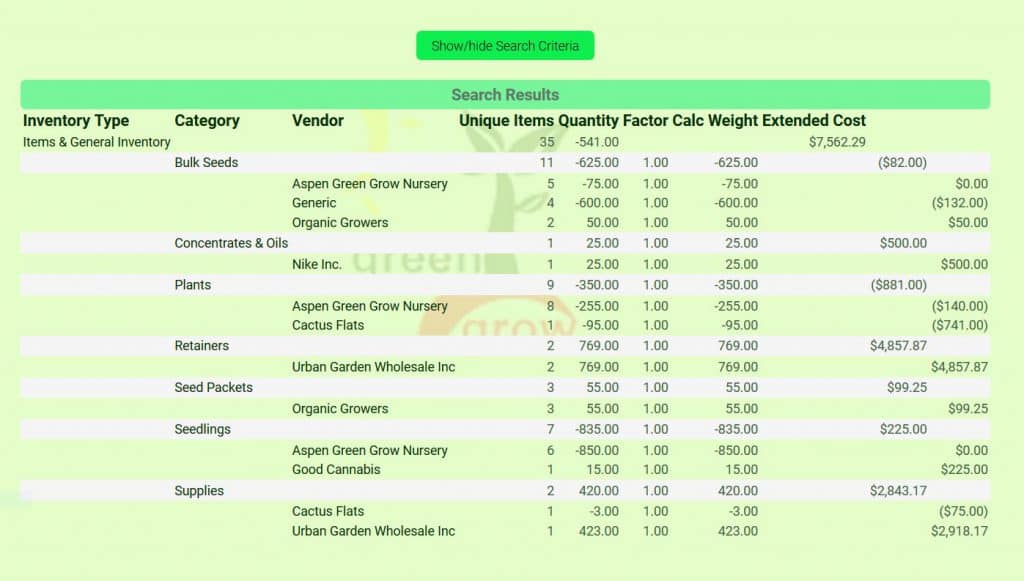
QUANTITY/WEIGHT
You can select specific categories or view all, as well as vendor and date range. If you are selling as each and reporting or tracking by the gram i.e. 3.5, then the report would show a quantity of 1 and weight of 3.5.
USAGE/HISTORY
Under construction to be new and improved…coming soon!
PRICE POINT
Price point report shows by vendor, category, and date range (defaults to all) units sold, revenue received, and average price per unit. (Ex. report will show that you sold 55 ounces (28g) last week for $4,705, and the average price for one of those ounces was $85.55.)
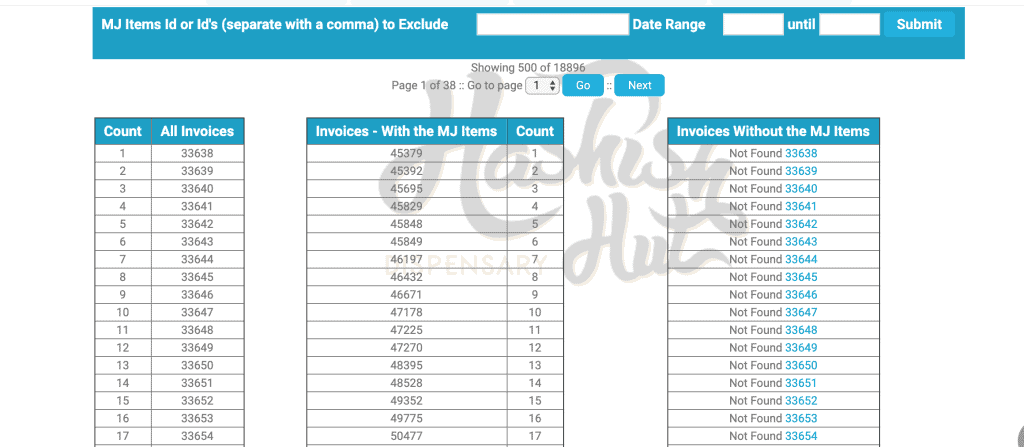
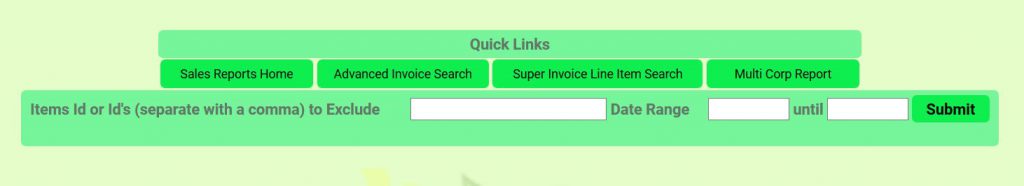
EXCLUDE
Allows you to exclude certain items from the report you are running, in a specified time period. Will display invoices with the item and without.
PO LINE SUM/CATEGORY
This reports shows total quantity from PO’s on specified dates for a category. A quick way to view what was added to your inventory on a given day.
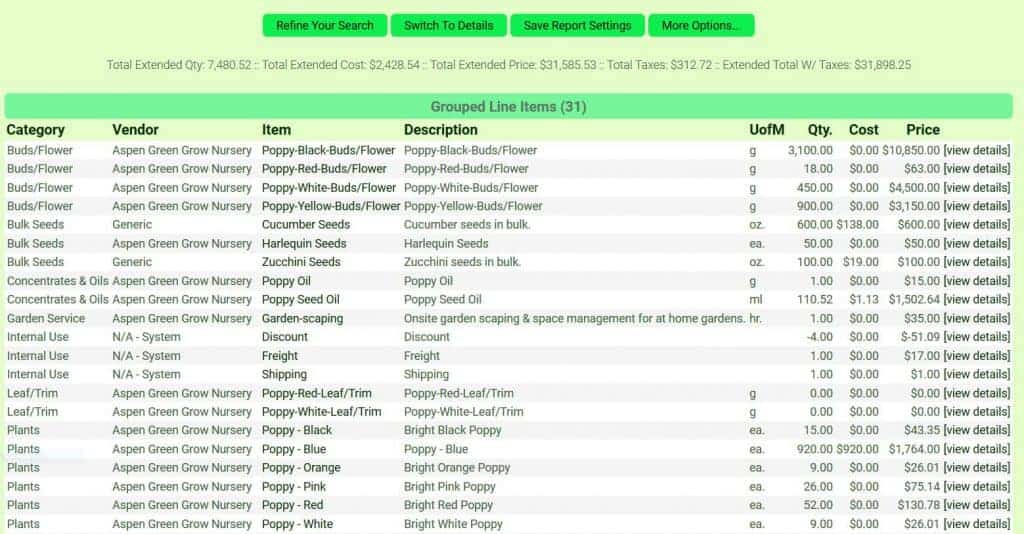
GROUPED
Shows your inventory report by item, quantity and cost.
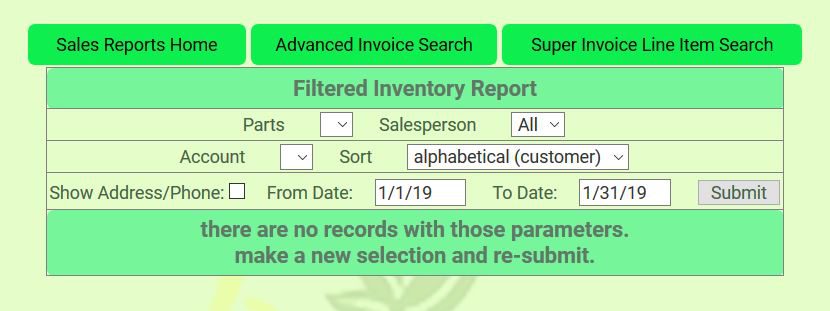
FILTERED INVENTORY
This report allows you to choose a date range and a specific inventory item or salesperson (or both) and see how many units were sold.
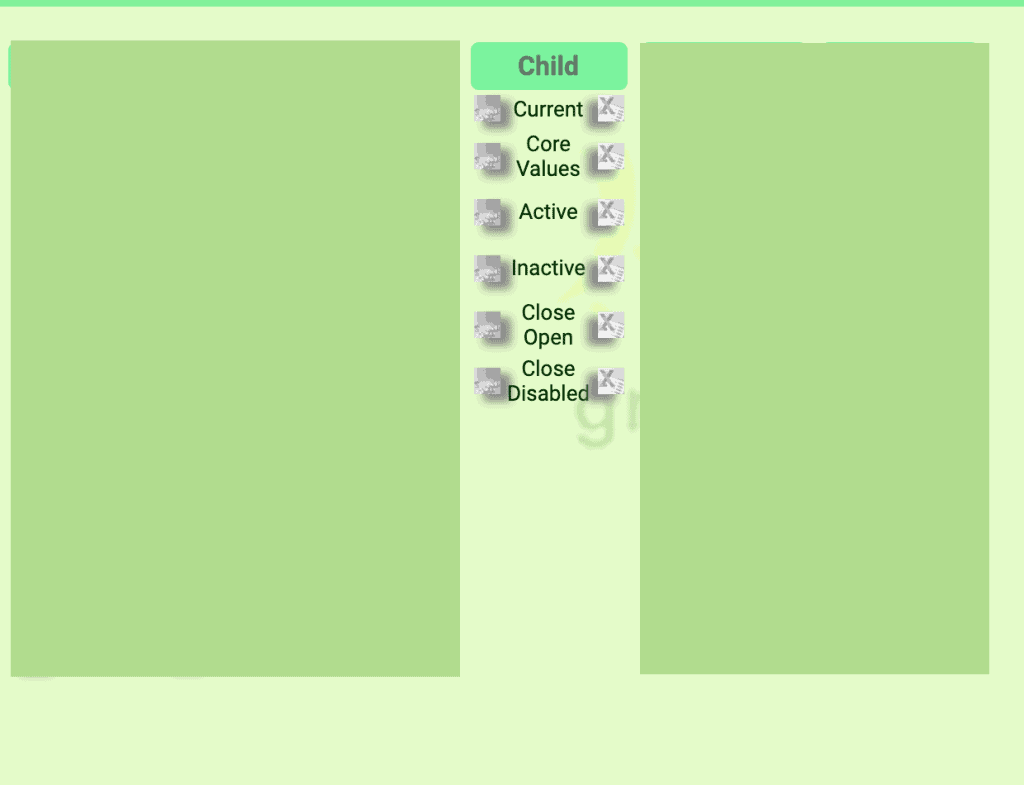
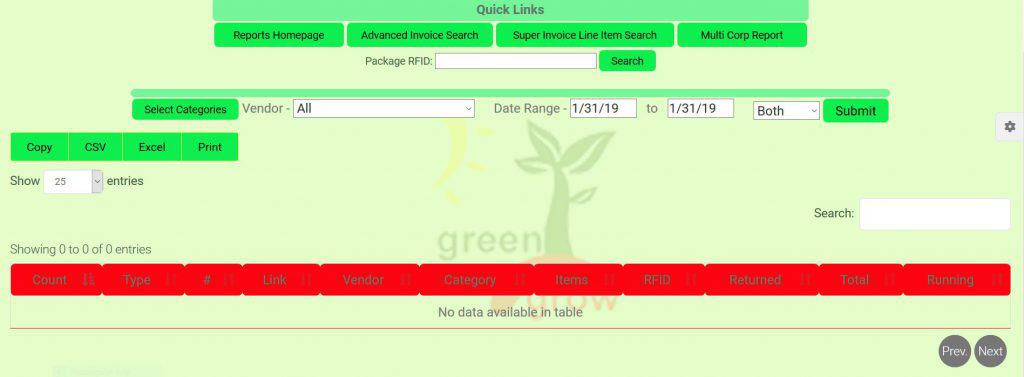
CURRENT
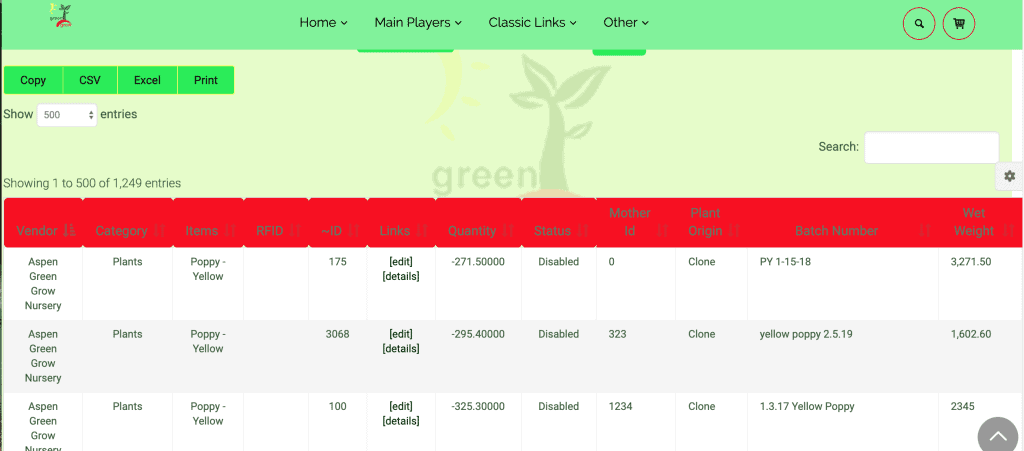
Sort by Category and see sub information including vendor, item, quantity, status, and all sub attributes associated with the item.
CORE VALUES
Another report that gives you quick access to new inventory data. For the data range entered you can view new subs that were created, as well as other relevant sub item info such as quantity, cost, price, rfid number, vendor, item description, and sub item status.
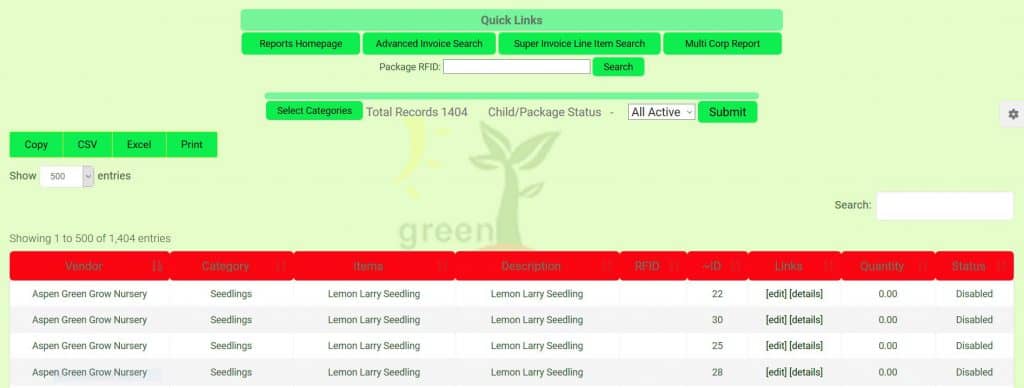
ACTIVE
This report can be limited to certain categories, as well as choosing sub status ie. open or disabled. You can also see sub details such as rfid number and quantity.
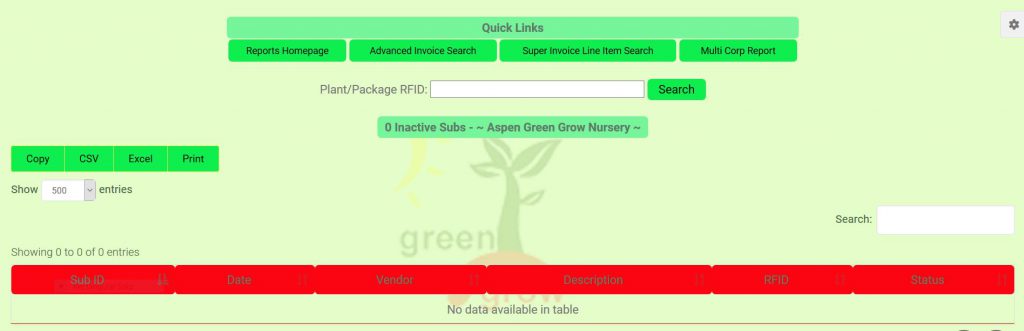
INACTIVE
Search for a particular inactive sub by rfid number, or simply sort and view inactive subs. Rfid fields can be edited in this report, should that be needed.
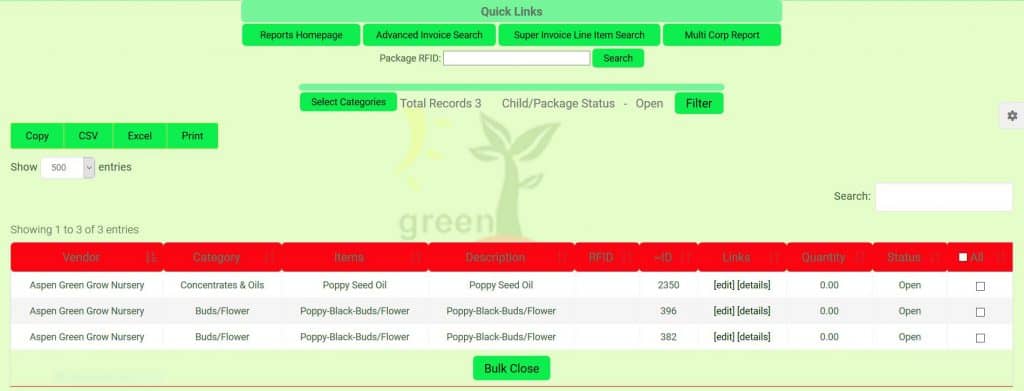
CLOSE OPEN
This report will show you all open subs that are at zero quantity, and then allow you to bulk close them all at one time.
CLOSE DISABLED
Select a category or search by rfid tag to find subs that are disabled and need to be closed. This is a great way to clean out plant “inventory” that has been harvested.
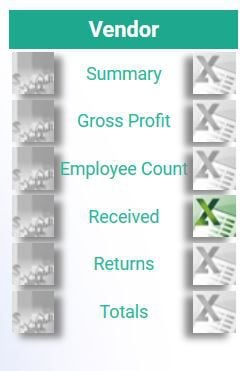
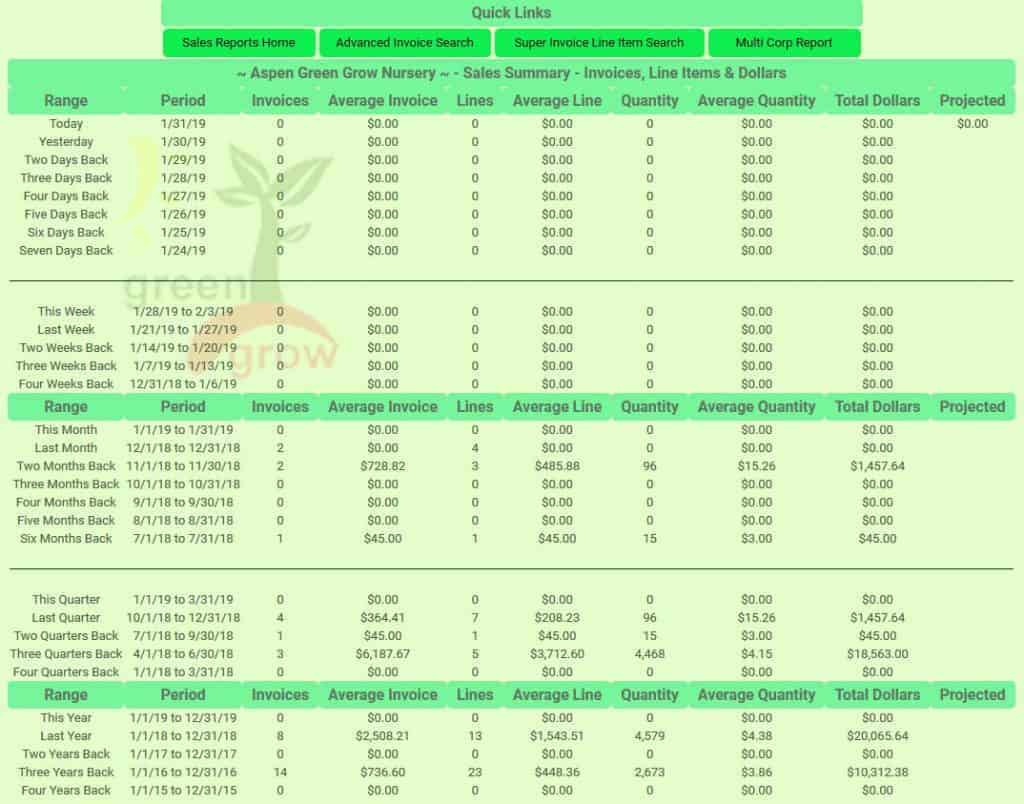
SUMMARY
This report shows sales data by vendor. Details include various date ranges- from today to four years prior, as well as number of invoices, average sale per invoice, and total dollars.
GROSS PROFIT
Great for seeing how profitable a particular vendor’s products are for your business. Select date range and see quantity sold, sale price, cost, gross profit, and percentage of profit. (similar to Items Gross Profit report.)
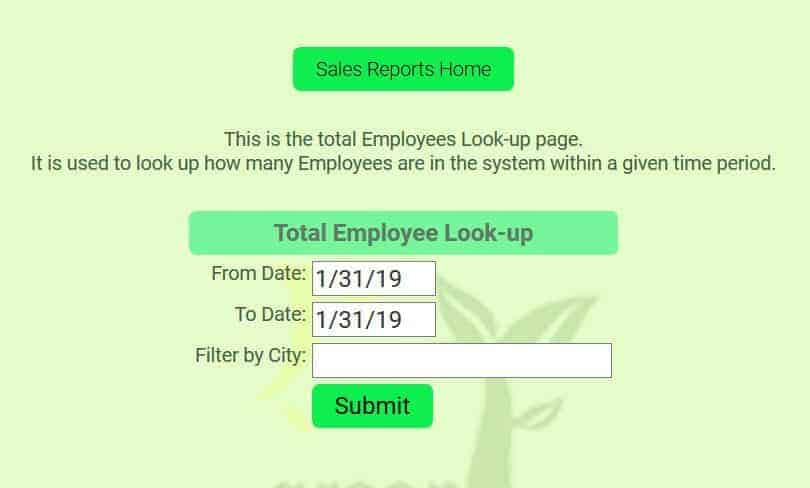
EMPLOYEE COUNT
This is the total Employees Look-up page.
It is used to look up how many Employees are in the system within a given time period.
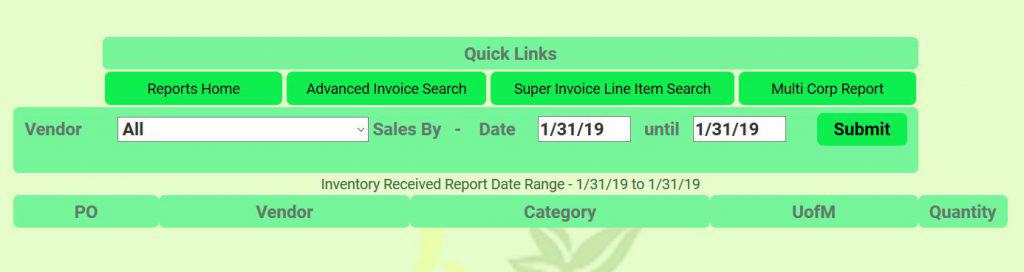
Received
Look up PO’s and inventory that was entered into your system on a particular day/date.
Returns
If your state allows returns, you may search for these quickly through this report. Choose date range and vendor, then if you used a PO or invoice for the return.
Totals
See your total sales by vendor and category in this report. Choose your date range and also see vendor quantity sold, cost, and profit. One unique feature of this report is the total of all the vendor data at the top, which shows total quantity sold, total sales, total cost, and total profit.
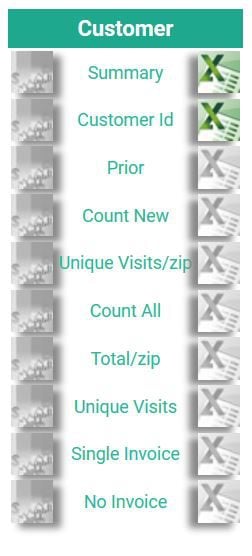
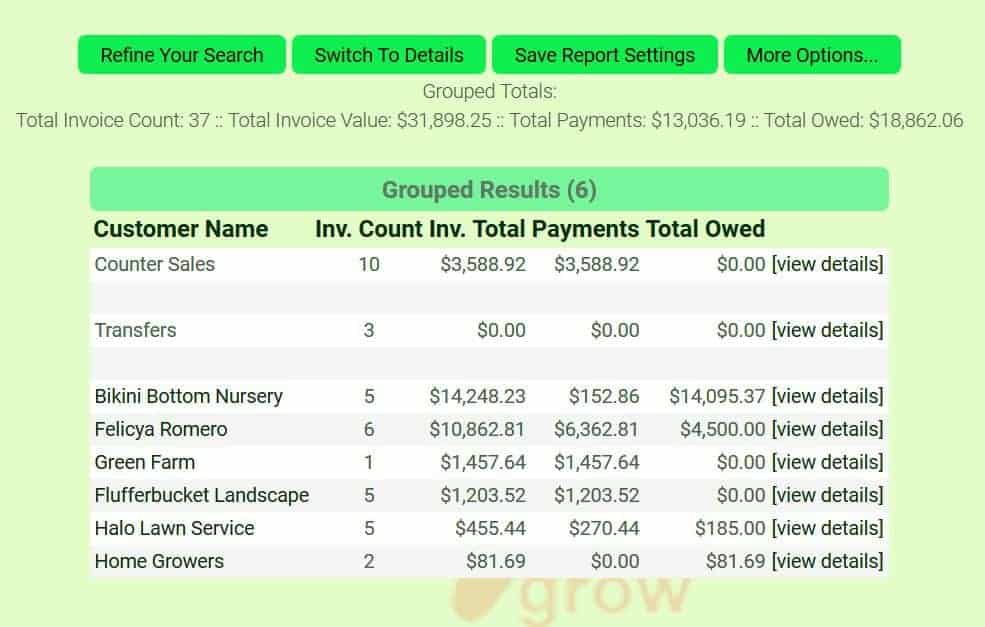
Summary
Customer summary shows how many invoices per customer, as well as invoice totals and payments. There is no date range to be selected on this page, so this summary includes ALL activity for the customer.
Customers ID
All sales activity by customer id. You may select a date range on this report.
Prior
Shows sales by customer by their most recent purchase with date.
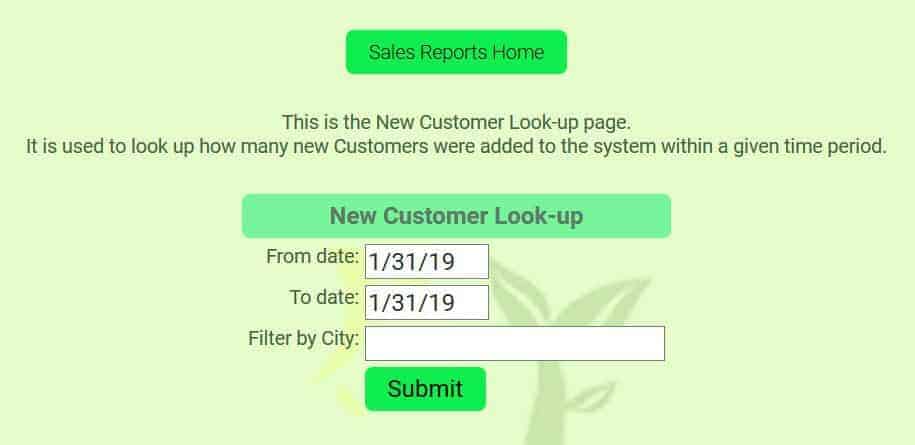
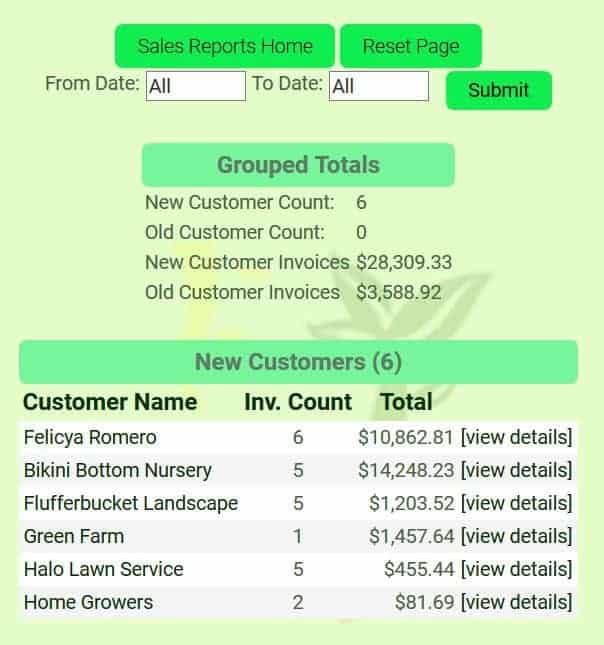
Count New
Enter a date range and search for new customers in the database.
Unique Visits/Zip
You may filter your customer search by their zip code to see how many times they shopped at your store.
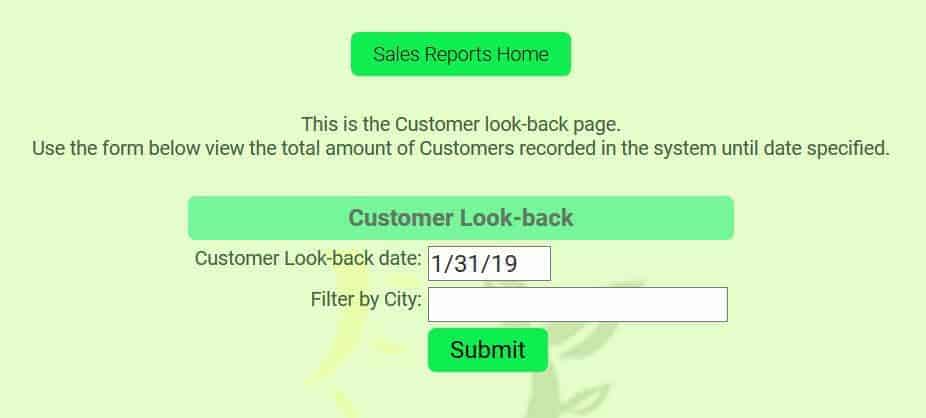
Count All
This report will show you how many customers you have in a certain city in a specified date range. If you leave the city field blank, it will show you how many customers you have total.
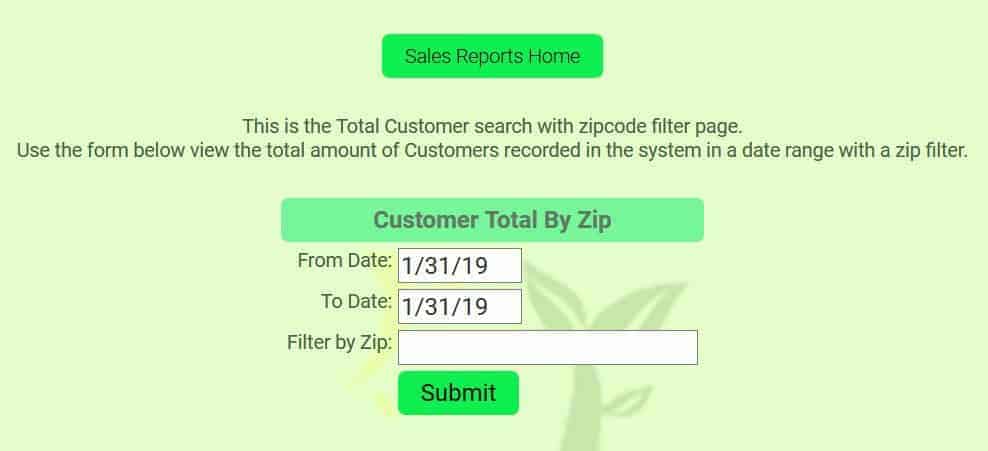
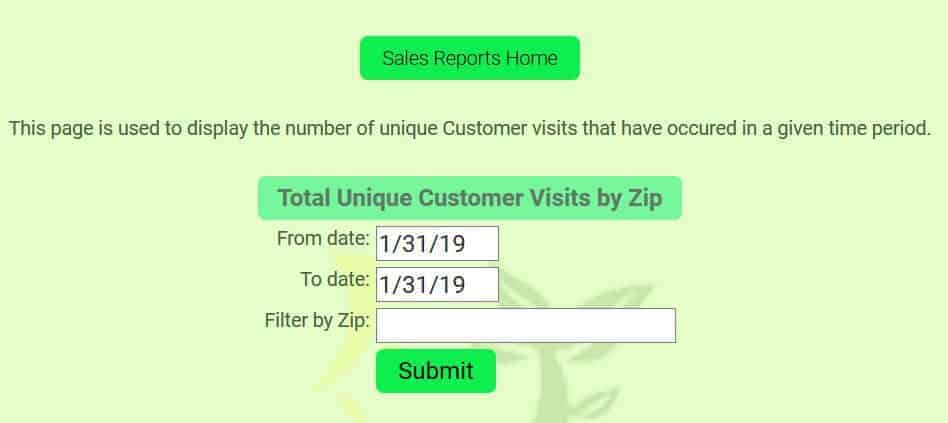
Total/Zip
Enter a date range and see report of how many customers you have in each zip code. Filter by choosing a particular zip code.
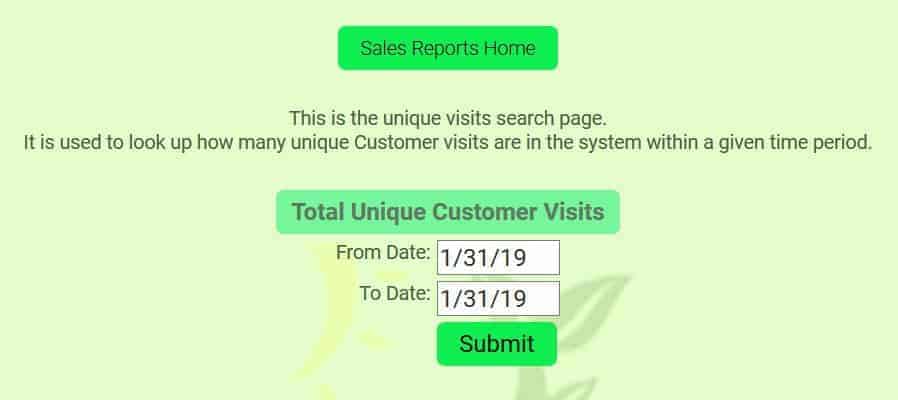
Unique Visits
By entering a date range you can see how many customers visited your store one time.
Single Invoice
Choose a date range for a report that shows how many transactions a customer has during that time period. You can click on details to see specific invoices.
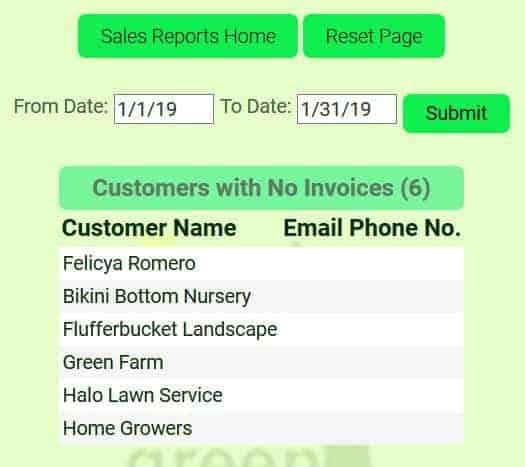
No Invoice
Enter a date range and see what customers have not been shopping with you during that time frame.
As always, please feel free to reach out to your consultant, Technical Support at 719-966-7102, or email support@adilas.biz if you have any questions, concerns, or suggestions. Many of these reports have been created to meet the specific reporting needs of various cities and states. If there is a report you need that isn’t found on this page, please contact your consultant or technical support to request a quote for your particular project.