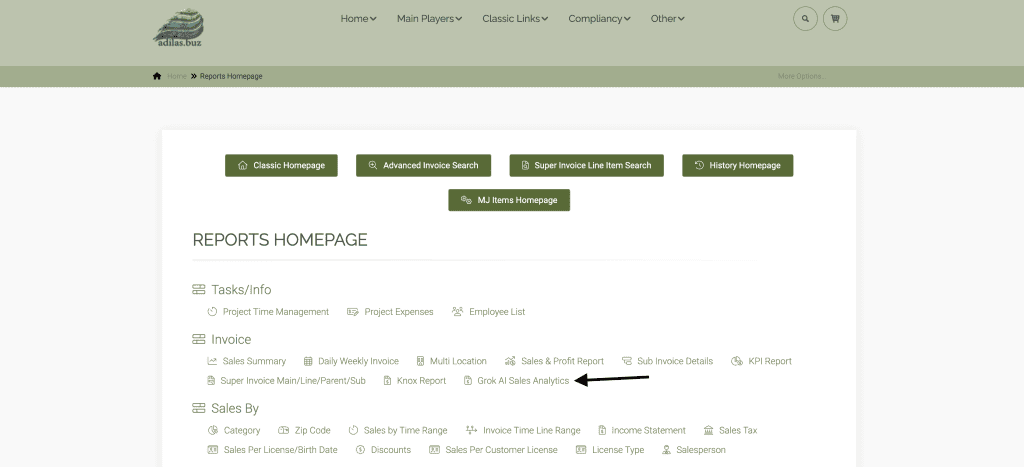
To access this report, go to the reports homepage.
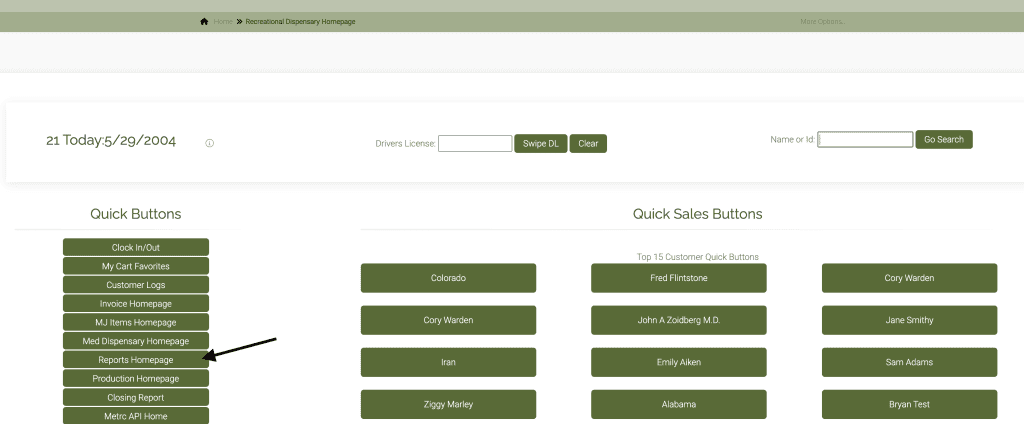
Click on the Grok Sales Analytics link.
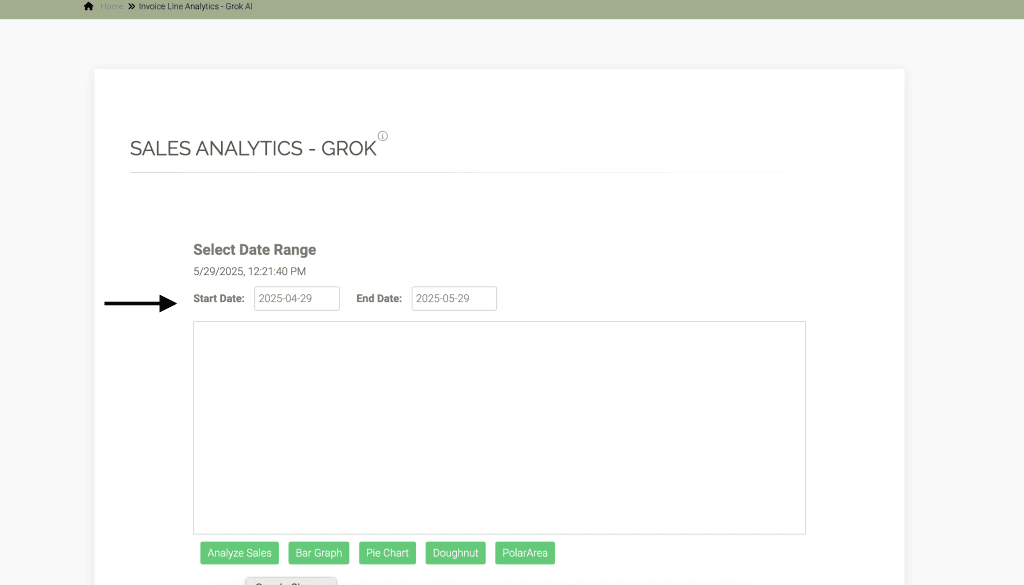
Click on the ‘i’ to learn more about this page and how it works.
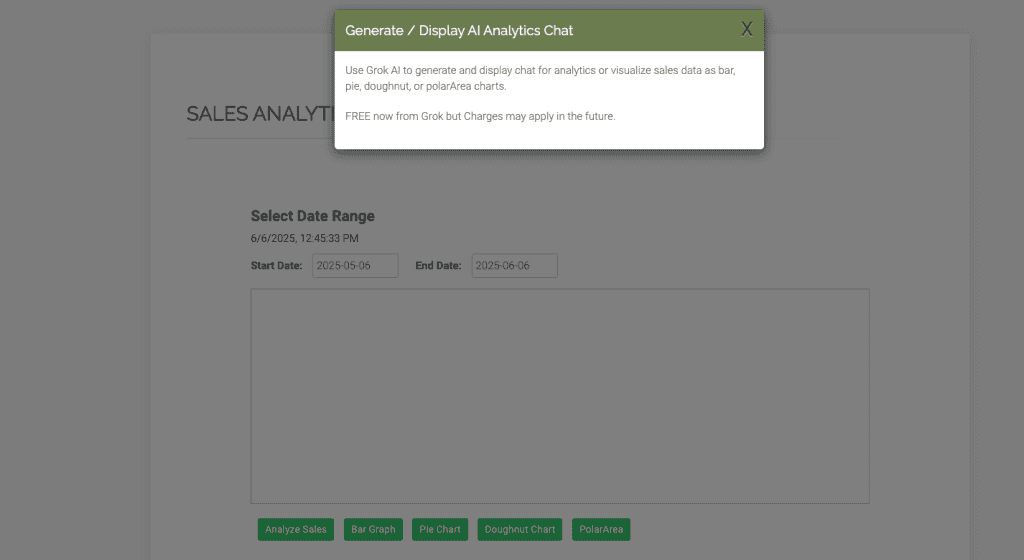
The date range will default to the prior month.
In this example, we changed the date to include the entire year to date.
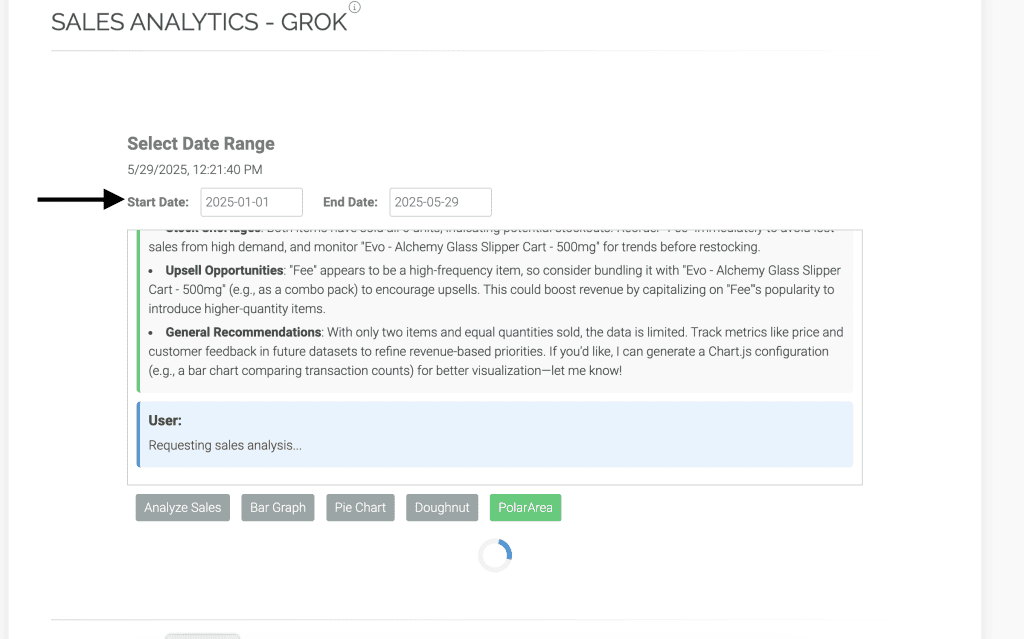
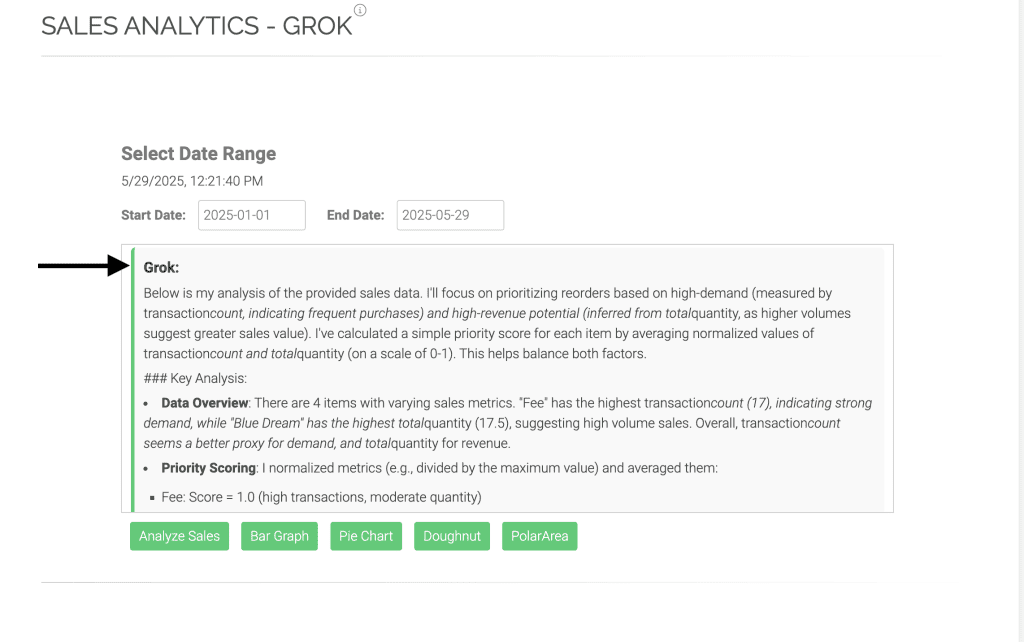
The prompt that is built in is to analyze sales data and make reorder recommendations.
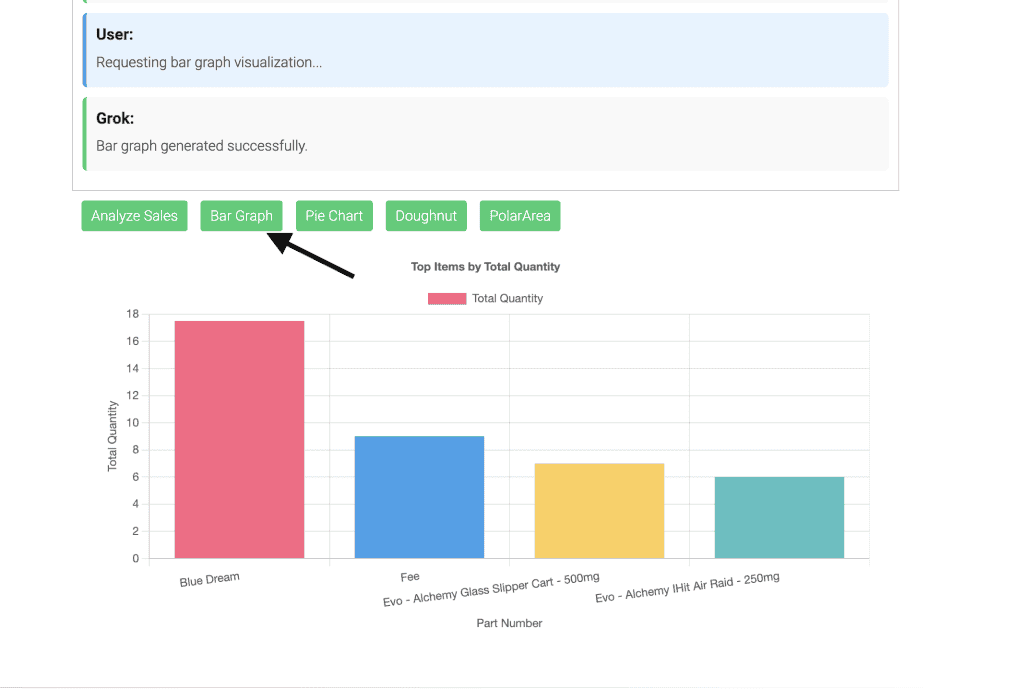
You can choose to see the data in a bar graph….
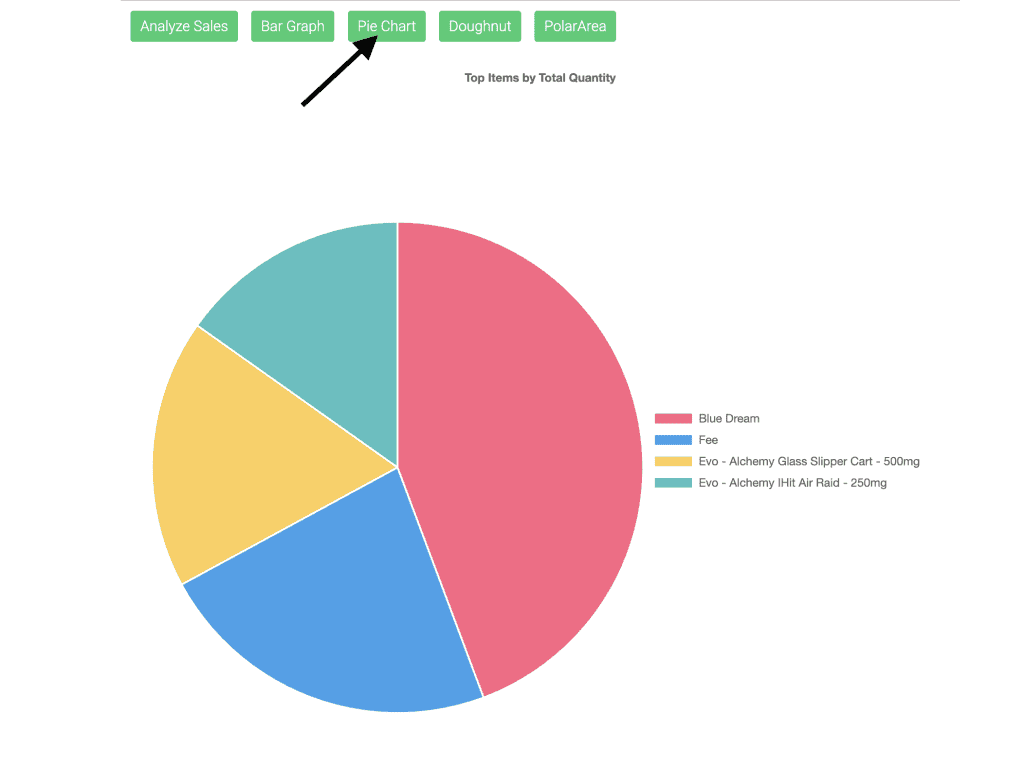
A pie chart….
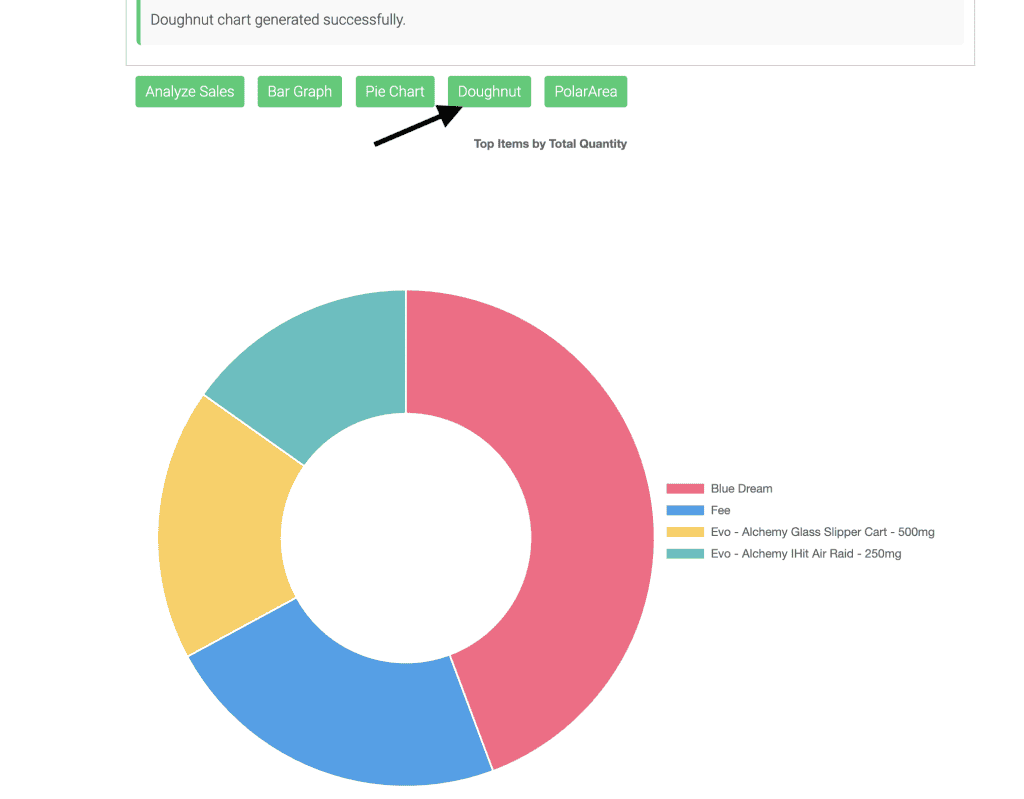
A doughnut….
Or a polar area….

If you would like to see another prompt built into adilas, please reach out to us at our support number below and we would be glad to get you a quote.
As always, please feel free to reach out to Technical Support at 720-740-3046 or email support@adilas.biz if you have any questions, concerns, or suggestions.